Prometheus and Grafana with Redis Software
Use Prometheus and Grafana to collect and visualize Redis Software metrics.
You can use Prometheus and Grafana to collect and visualize your Redis Software metrics.
Metrics are exposed at the cluster, node, database, shard, and proxy levels.
- Prometheus is an open source systems monitoring and alerting toolkit that aggregates metrics from different sources.
- Grafana is an open source metrics visualization tool that processes Prometheus data.
You can use Prometheus and Grafana to:
-
Collect and display metrics not available in the Cluster Manager UI
-
Set up automatic alerts for all resources
-
Display Redis Software metrics alongside data from other systems
To get started with Prometheus and Grafana, see the following quick start or see Redis Software Observability with Prometheus and Grafana for a more detailed tutorial.
Quick start
Hardware requirements
The minimum hardware requirements to set up Redis Enterprise Software monitoring in production using Prometheus, Grafana, and the metrics stream engine are:
- CPU: 4 vCPUs
- Memory: 8-12 GB RAM
- Storage: 100 GB SSD
You should also consider the following to determine your deployment's hardware requirements:
-
The number of Redis instances being scraped.
-
Lower scrape intervals, such as 15 seconds versus 1 minute, increase resource usage. The Redis scraping interval is 30 seconds.
-
Longer retention increases storage requirements. Basic retention is 90 days.
-
For high availability, run Prometheus in a replicated or federated mode for redundancy, and use Grafana’s load balancing for multiple users.
-
Factor in overhead if Prometheus is writing metrics to remote storage such as Thanos or Cortex.
-
Ensure high disk IOPS for Prometheus TSDB for better write and read performance.
For more details about Grafana hardware requirements, see the offical Grafana documentation.
Setup steps
To get started with Prometheus and Grafana:
-
Install Docker on your system. For installation instructions, see the official Docker documentation.
-
Create a directory called 'prometheus' on your local machine.
-
Within that directory, create a configuration file called
prometheus.yml. -
Add the following contents to the configuration file and replace
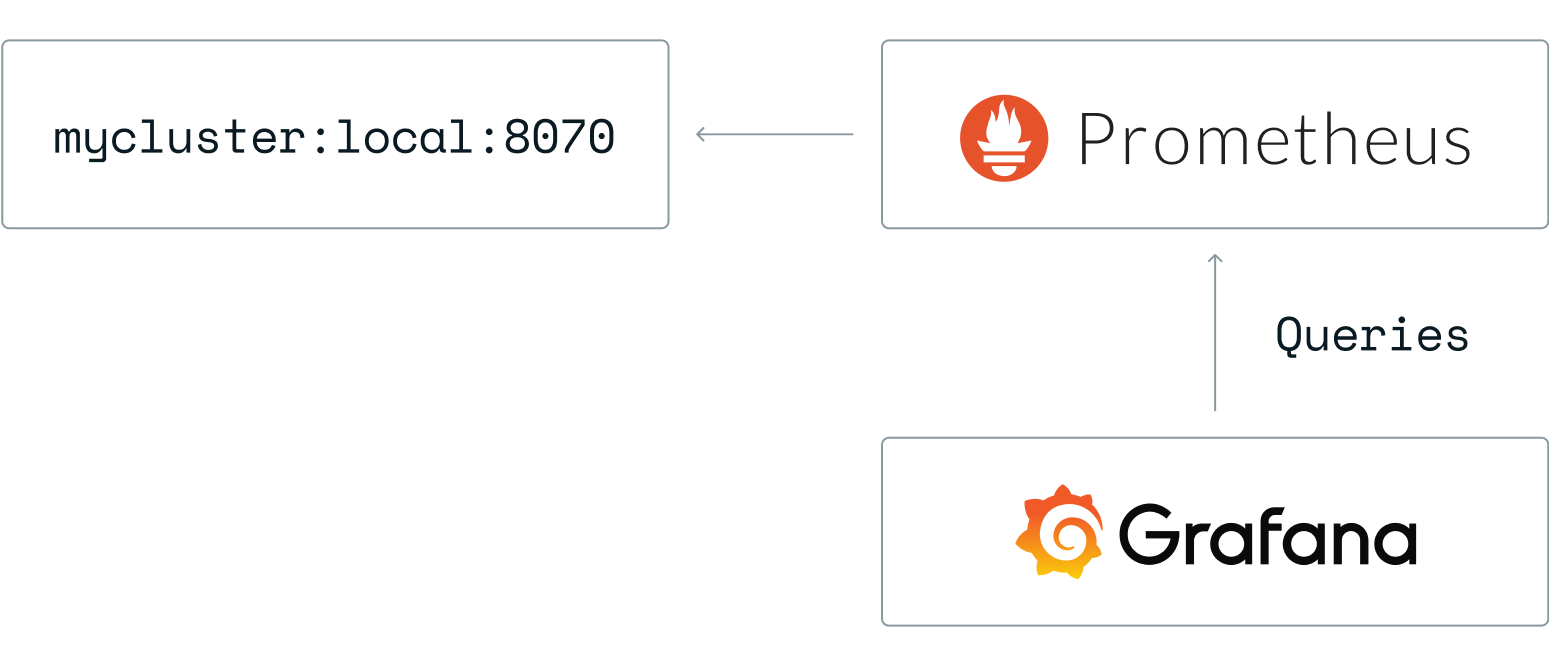
<cluster_name>with your Redis Software cluster's FQDN:global: scrape_interval: 15s evaluation_interval: 15s # Attach these labels to any time series or alerts when communicating with # external systems (federation, remote storage, Alertmanager). external_labels: monitor: "prometheus-stack-monitor" # Load and evaluate rules in this file every 'evaluation_interval' seconds. #rule_files: # - "first.rules" # - "second.rules" scrape_configs: # scrape Prometheus itself - job_name: prometheus scrape_interval: 10s scrape_timeout: 5s static_configs: - targets: ["localhost:9090"] # scrape Redis Software - job_name: redis-enterprise scrape_interval: 30s scrape_timeout: 30s metrics_path: /v2 scheme: https tls_config: insecure_skip_verify: true static_configs: - targets: ["<cluster_name>:8070"] -
Set up your Prometheus and Grafana servers. See the official Prometheus installation and Grafana installation documentation for help.
Note:We recommend running Prometheus in Docker only for development and testing.To set up Prometheus and Grafana on Docker, follow these steps. For additional help, see the official Prometheus and Grafana Docker image documentation.
-
Create a docker-compose.yml file:
version: '3' services: prometheus-server: image: prom/prometheus ports: - 9090:9090 volumes: - ./prometheus/prometheus.yml:/etc/prometheus/prometheus.yml # Persistent storage for Prometheus - prometheus-data:/prometheus grafana-ui: image: grafana/grafana ports: - 3000:3000 environment: - GF_SECURITY_ADMIN_PASSWORD=secret volumes: # Persistent storage for Grafana - grafana-storage:/var/lib/grafana links: - prometheus-server:prometheus # Define Docker-managed volumes for persistent storage # These volumes are created automatically and persist data between container restarts volumes: prometheus-data: grafana-storage: -
To start the containers, run:
$ docker compose up -d -
To check that all of the containers are up, run:
docker ps -
In your browser, sign in to Prometheus at
http://localhost:9090to make sure the server is running. -
Select Status and then Targets to check that Prometheus is collecting data from your Redis Software cluster.
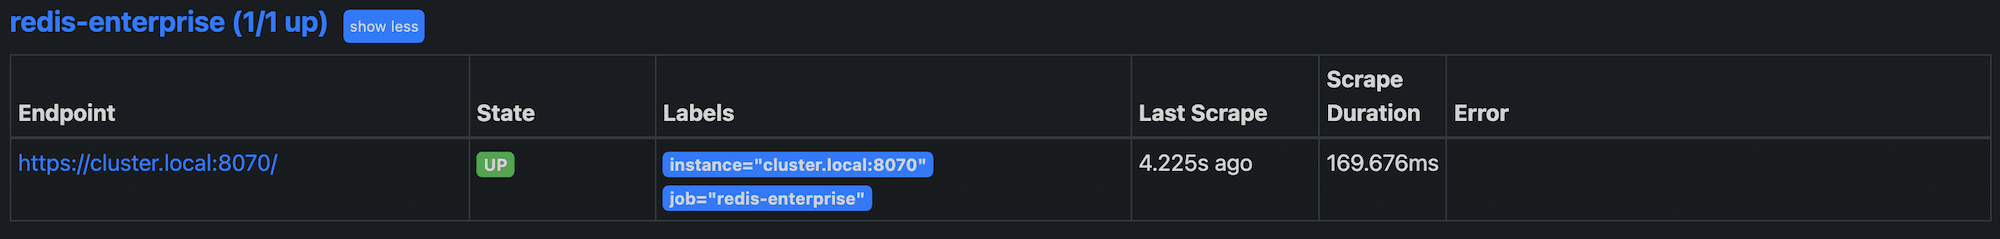
If Prometheus is connected to the cluster, you can type node_up in the Expression field on the Prometheus home page to see the cluster metrics.
-
-
Configure the Grafana datasource:
-
Sign in to Grafana. If you installed Grafana locally, go to
http://localhost:3000and sign in with:- Username: admin
- Password: secret
-
In the Grafana configuration menu, select Data Sources.
-
Select Add data source.
-
Select Prometheus from the list of data source types.

-
Enter the Prometheus configuration information:
- Name:
redis-enterprise - URL:
http://<your prometheus server name>:9090
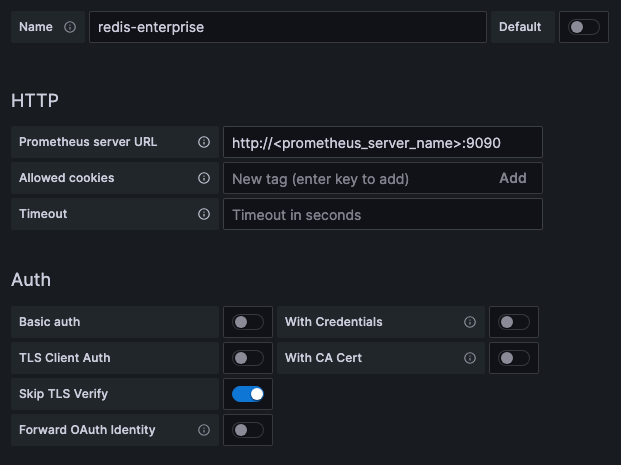
- Name:
Note:- If the network port is not accessible to the Grafana server, select the Browser option from the Access menu.
- In a testing environment, you can select Skip TLS verification.
-
-
Add dashboards for cluster, database, node, and shard metrics. To add preconfigured dashboards:
- In the Grafana dashboards menu, select Manage.
- Click Import.
- Upload one or more Grafana dashboards.
-
To set up alerts in Prometheus or Grafana, see the following resources:
Grafana dashboards for Redis Software
Redis publishes preconfigured dashboards for Redis Software and Grafana.
These dashboards are open source. For additional dashboard options, or to file an issue, see the Redis Software observability Github repository.
For more information about configuring Grafana dashboards, see the Grafana documentation.
Use the following dashboards when connecting to the v2 metrics endpoint (https://<cluster_name>:8070/v2):
- The cluster status dashboard provides an overview of your Redis Software clusters.
- The database status dashboard displays specific database metrics, including latency, memory usage, ops/second, and key count.
- The node metrics dashboard provides metrics for each of the nodes hosting your cluster.
- The shard metrics dashboard displays metrics for the individual Redis processes running on your cluster nodes.
- The Active-Active dashboard displays metrics specific to Active-Active databases.
- The QPS dashboard - Redis Search metrics displays metrics specific to Redis Search, showcasing QPS, Query Latency, Indexing performance, and more.
- The OPS dashboards are advanced operational dashboards for on-premises deployments.